


SaaS metrics are numerical indicators that measure the revenue health, customer behavior, and growth quality of a subscription-based software company. The most critical starting points are MRR, Churn Rate, and the LTV/CAC ratio. Which metric takes priority depends directly on the company's growth stage; companies that fail to read these metrics in the correct order often miss signals that could have been identified before turning into revenue loss.
Managing a SaaS company by looking only at the income statement is like driving a car by looking in the rearview mirror. Monthly revenue might appear to be increasing, but customer churn could be silently accumulating, the cost of growth might be becoming unsustainable, or the most profitable segment might be withdrawing from the system. The true value of metrics lies in seeing these signals before the loss actually occurs. This guide does not just list the metrics; it also answers which ones you should focus on at each stage.
What are SaaS metrics, and why shouldn't you track them all with the same priority?
SaaS metrics are evaluated in four main categories: revenue metrics, customer metrics, growth quality metrics, and usage metrics. Each category drives a different business decision; prioritizing the wrong category at the wrong time creates unnecessary noise.
For a startup, tracking ten metrics at once often yields the same result as tracking none at all. This is because every metric requires a process, an owner, and a threshold value behind it to be meaningful. Calculating Net Revenue Retention when you don't have fifty customers is statistically misleading. Explaining customer churn without usage data is impossible.
The "vanity metric" trap, common in the market, is a frequent issue, especially for early-stage SaaS teams. Total registrations, page views, or app download numbers provide a sense of growth but do not guide decision-making. In contrast, MRR components, the LTV/CAC ratio, and Churn Rate produce directly actionable data. Discipline in metric selection provides operational clarity in every process, from investment decisions to product prioritization.
Which metrics accurately measure your revenue health?
MRR (Monthly Recurring Revenue) is the total revenue a SaaS company earns regularly each month. ARR (Annual Recurring Revenue) is obtained by multiplying MRR by 12 and is preferred for investor meetings and annual planning processes.
Treating MRR as a single number hides growth dynamics. A healthy MRR analysis tracks four components separately: New MRR (revenue from new customers), Expansion MRR (revenue added through plan upgrades by existing customers), Contraction MRR (decline resulting from plan downgrades or reduced usage), and Churned MRR (loss caused by customers who have left entirely).
Net New MRR = New MRR + Expansion MRR - Contraction MRR - Churned MRR
In this formula, when Net New MRR falls into the negative, new acquisitions are no longer able to compensate for losses. While the company continues to talk about growth, it is actually shrinking; this situation can go unnoticed for months.
Net Revenue Retention (NRR) is one of the most overlooked yet most important growth signals in Turkish resources. NRR provides the ratio of revenue obtained from the existing customer base after one year compared to the start, excluding new customers.
NRR = (Starting MRR + Expansion - Contraction - Churn) / Starting MRR x 100
According to findings from ChartMogul's 2023 SaaS Benchmarks Report, companies with an NRR of over 100 percent grew nearly twice as fast as their peers. An NRR above 100 percent means the company is growing even without new customer acquisition. For B2B SaaS, the range considered excellent for NRR is between 110 and 125 percent.
Are your customer acquisition cost and customer value in balance?
CAC (Customer Acquisition Cost) and LTV (Lifetime Value), when considered together, clearly demonstrate the sustainability of a business model. The point where CAC exceeds LTV means the company is losing money on every new customer.
The most common mistake made when calculating CAC is including only advertising spend. A correct CAC calculation should encompass all salary expenses of the sales and marketing team, license costs of tools used, and agency expenditures.
CAC = Total Sales and Marketing Expenses / Number of New Customers Acquired
LTV is the estimated total revenue a customer will generate throughout their relationship with the company.
LTV = ARPA (Average Revenue Per Account) x Gross Margin / Monthly Churn Rate
An LTV/CAC ratio between 3x and 5x indicates a healthy business model. According to 2024 Benchmarkit data, the median LTV/CAC for SaaS companies is 3.6:1. A ratio below 1x is unsustainable, while anything above 5x suggests that growth investments are not aggressive enough.
The CAC Payback Period measures how many months it takes for the revenue generated from a customer to cover the cost of acquiring them.
CAC Payback Period = CAC / (ARPA x Gross Margin)
The goal is to stay under 12 months. Payback periods exceeding 18 months create significant financial pressure, especially for companies with limited cash flow.
The Churn Rate directly impacts both LTV and NRR within this equation. It is measured in two ways: Logo Churn represents the number of customers lost, while Revenue Churn reflects the lost revenue. Two companies with the same Logo Churn can have significantly different Revenue Churn figures depending on the size of the lost customers. Therefore, it is essential to track both types.
Industry benchmarks for core SaaS metrics
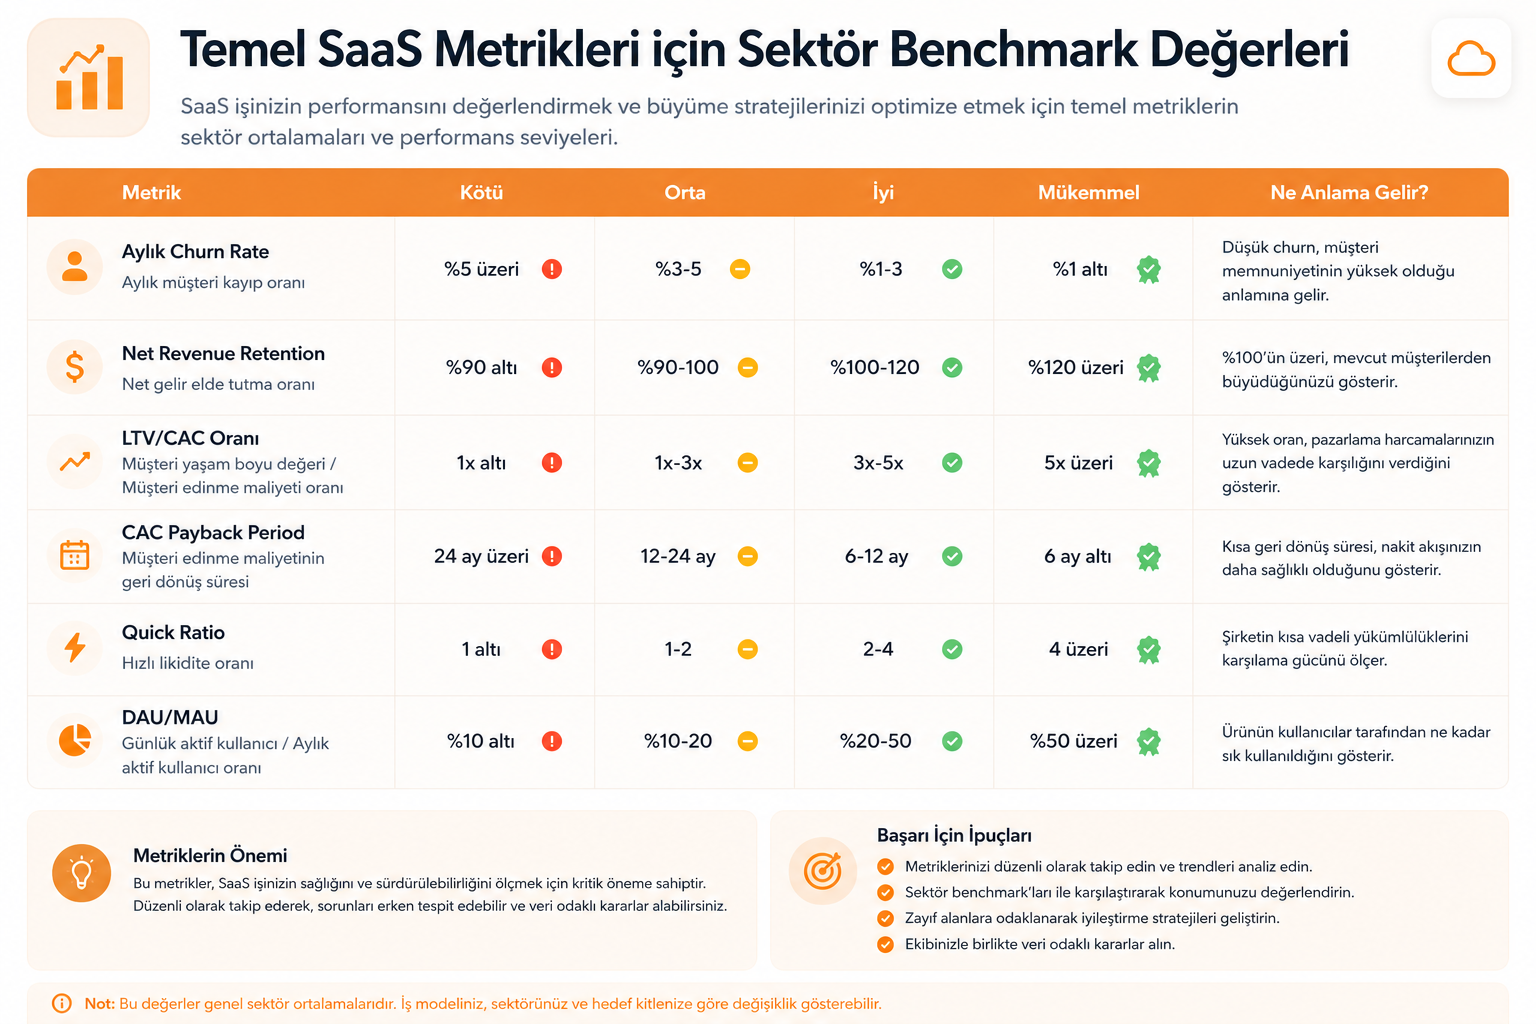
These values reflect industry averages. There are significant differences between B2B enterprise SaaS and SMB-focused products; comparing yourself against competitors in your specific segment provides more reliable results.
Which metrics measure the quality of growth?
The Quick Ratio reveals the true health behind high growth figures. A company may be growing rapidly, but you cannot evaluate the quality of that growth without knowing how much comes from new revenue versus how much is just enough to offset losses.
Quick Ratio = (New MRR + Expansion MRR) / (Churned MRR + Contraction MRR)
If the ratio is above 4, the company is both growing and building a healthy customer base. A ratio below 1 indicates that every newly acquired customer is barely compensating for those lost.
The DAU/MAU ratio (Daily Active Users / Monthly Active Users) measures whether a product builds user habits. Values between 20% and 50% indicate good engagement, while anything above 50% suggests the product has become an integral part of the user's routine. If this ratio begins to drop, it often serves as a leading indicator of increased churn 30 to 60 days in advance.
NPS (Net Promoter Score) provides a snapshot of customer satisfaction but does not predict churn. Therefore, tracking NPS alone can be misleading; when used alongside Cohort Retention analysis, the gap between satisfaction and true loyalty becomes visible.
Which metrics should you focus on at each growth stage?
Prioritizing metrics based on growth stage is a topic rarely covered in local resources but is critically important in practice. At each stage, a different fundamental question takes precedence, and the metrics that best answer that question become the priority.
In the early stage (between 0 and 50 customers), the main question is: "Are people continuing to use this product?" Churn Rate and DAU/MAU are the focus here. You can track MRR, but interpreting proportional metrics like NRR with a small sample size is misleading. The primary goal is to validate product-market fit, which is best achieved through usage data.
In the growth stage (when MRR growth rate is above 20%), understanding the cost of the revenue engine becomes critical. The LTV/CAC ratio and CAC Payback Period take center stage. Tracking which channels and customer segments drive growth via Expansion MRR is essential for directing growth investments effectively.
In the maturity stage (when growth slows but the customer base deepens), NRR and the Quick Ratio become the deciding factors. Companies that cannot generate Expansion revenue from existing customers at this stage become dependent on ever-increasing sales and marketing budgets to grow. This erodes unit economics and negatively impacts company valuation in the eyes of investors.
Frequently Asked Questions About SaaS Metrics
What is the main difference between MRR and ARR?
MRR represents recurring revenue on a monthly basis, while ARR is an annual revenue projection calculated by multiplying MRR by 12. Companies with a monthly subscription model typically use MRR, while enterprise SaaS companies with annual contracts use ARR as their primary revenue metric. It is possible to track both; the goal is to make growth comparable across different timeframes.
What is a good churn rate?
In the industry, a monthly churn rate between 1% and 3% is considered healthy, while anything below 1% is excellent. While this rate is inherently low in B2B enterprise SaaS, it may hover between 3% and 5% for SMB-focused products. The key is to use your specific customer segment's average as a benchmark and interpret the monthly trend holistically.
Why should the LTV/CAC ratio be between 3x and 5x?
An LTV/CAC ratio between 3x and 5x means that for every unit of currency spent on customer acquisition, three to five units of value are generated. Staying below 1x indicates that you are losing net money on every new customer, which requires immediate intervention. While exceeding 5x might look good on paper, it can be a sign that you aren't investing enough in growth channels and are underutilizing your growth potential.
Why should I track product usage metrics alongside financial metrics?
Financial metrics measure past performance, while usage metrics predict the future. A decline in DAU/MAU usually precedes an increase in churn by 30 to 60 days. Catching this signal early gives your customer success team time to intervene proactively and prevent revenue loss.
TL;DR
- SaaS metrics are evaluated in four categories: revenue, customer, growth quality, and usage; treating all categories with the same priority can be misleading.
- Reading MRR not as a single figure, but by breaking it down into New, Expansion, Contraction, and Churned components, reveals the true dynamics of your growth.
- Maintaining an LTV/CAC ratio between 3x and 5x and keeping the CAC Payback period under 12 months are the fundamental conditions for sustainable growth.
- A company with an NRR above 100% is growing even without acquiring new customers; according to ChartMogul data, these companies grow nearly twice as fast as their competitors.
- Priorities shift based on the growth stage: Churn and usage are critical in the early stage, LTV/CAC in the growth stage, and NRR and Quick Ratio in the maturity stage.
Conclusion
Tracking SaaS metrics correctly isn't about how much data you monitor, but knowing which data drives which decision. Investors look at NRR because growth from existing customers proves the product's true value. Operational teams look at Churn because it creates room for intervention before losses accumulate. Looking at the Quick Ratio tells you whether your growth figures represent real momentum or just covering up persistent churn.
Instead of perfecting a single metric, aim for several metrics to provide consistent signals. This consistency both accelerates growth decisions and creates the impression that the company has a healthy and predictable business model from the outside.
Compare the metrics you currently track with the growth stage table in this article. If there are missing metrics, start small: first, break down your MRR into its components, then calculate your LTV/CAC ratio and CAC Payback period. Once these three steps are complete, you can structure your metric prioritization according to your growth stage.
Resources
- ChartMogul SaaS Benchmarks Report: https://chartmogul.com/reports/saas-benchmarks-report/
İlginizi Çekebilecek Diğer İçeriklerimiz
A multi-LLM architecture is a system design that enables an organization to use multiple large language models simultaneously based on task type, rather than relying on a single model. Through model routing, observability, and fallback mechanisms, each query is directed to the most suitable model for that specific workload. The goal is to reduce vendor lock-in, optimize costs, and improve accuracy.
NaaS (Network as a Service) is a service model where businesses lease network services from a cloud provider via a subscription, rather than purchasing and managing their own network hardware. Functions such as firewalls, load balancing, VPNs, and WAN connectivity are delivered through software instead of hardware. This model transforms capital expenditure into operating expenses, making network infrastructure more agile and scalable.


